Ford Australia Reports Strong Profit Growth |
Ford Australia Reports Strong Profit Growth |
 Click the image for a larger view |
|
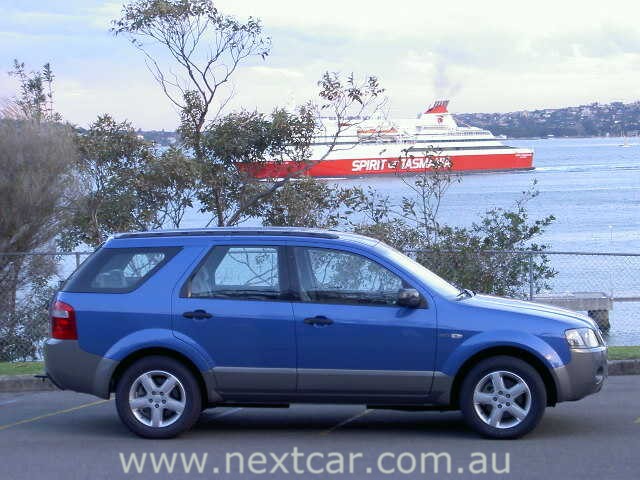
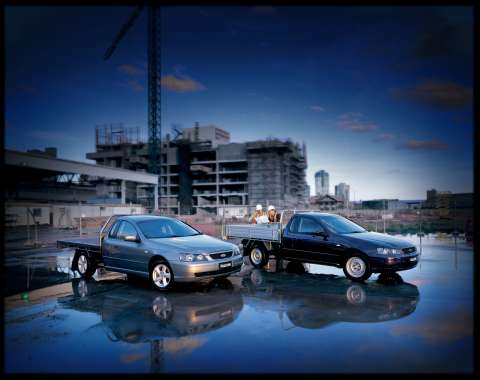
18th May, 2005 Ford Motor Company of Australia Limited* is announcing a net profit after tax of $185.6 million for calendar year 2004. This is the best profit result since 1996 and represents a 20 per cent improvement over the 2003 profit. Net sales revenue for 2004 was $4.1 billion, an increase of 5.6 per cent over the record $3.9 billion in sales posted in 2003. The strong profit result was driven by total sales of 135,172 vehicles, a 6.8 per cent increase over 2003 levels. Ford Australia President, Mr Tom Gorman, said the profit result reflects the company's strong performance during 2004, amid the increased competitiveness of a booming local car industry. "We recorded our best retail sales performance in almost a decade, which resulted in a total year market share of 14.2 per cent, up 0.3pts over the prior year. "2004 was also the second year in a row of market share growth for the company. The overwhelming market acceptance of the multi-award-winning Territory range, which saw it achieve segment leadership and the title of Top Selling SUV in Australia for six consecutive months in 2004, was the primary driver behind the sales increase." "That trend has continued into 2005 with Territory remaining sales leader in both the SUV Medium segment and the overall SUV sector, outselling its nearest competitor by 45 per cent or almost 2,500 vehicles," he said. "Territory's success has also been recognised on the world automotive stage – in New Zealand, where it has been the market-leading SUV since launch, and more recently on an even greater export scale with Ford of South Africa's decision to add the award-winning vehicle to its own line-up. "During 2004, Ford also successfully introduced the Fiesta brand to the Australian market where it immediately had an impact on the Light Car segment, recording 3,930 sales in just 10 months – a four-year high for a Ford Australia model in that class." Although Australia's traditional large car segment continued its share of market decline during 2004, Ford's new model introductions more than offset the reduction in Falcon sales. "Ford's Falcon Ute and imported commercial vehicle line-up have continued their strong presence in the light commercial vehicle sector, increasing sales by almost 1,000 vehicles on the previous year. Courier achieved its best result on record, while Falcon Ute finished just shy of its all-time record with sales in excess of 20,000 vehicles," Mr Gorman said. "Importantly for our business here in Australia, we sold a total of 101,279 locally produced vehicles during 2004. This represents a 5.7 per cent increase over 2003, which has our manufacturing plants continuing to operate at full capacity. "The strong 2004 profit result will allow us to reinvest in future model lines, investigate new technologies and product initiatives, and further streamline our manufacturing processes. "This reinvestment will be vital to the future development of our business as the Australian automotive market continues to become more competitive. We will continue our emphasis on developing quality vehicles that meet market demand; utilising our manufacturing plants to their best capacity; and reducing cost in our business," Mr Gorman said.
Ford Australia Production Figures – 2004
** includes export volumes of 8,348 vehicles
| |||||||||||||||||||||||||||||||||||||||||||||||||||||||||||||||||||||||||||||||||||||||||||||||||||||||||||||||||||||||||||||||||||||||||||||||||||||||||||||||||||||||||||||||||||||||||||||||||||||||||||||||||||||||||||||||||||||||||||||||||||||||||||||||||||||||||||||||||||||||||||||||||||||||||||||||||||||||||||||||||||||||||||||||||||||||||||||||||||||||||||||||||||||||||||||||||||||||||||||||||||||||||||||||||||||||||||||||||||||||||||||||||||||||||||||||||||||||||||||||||||||||||||||||||||||||||||||||||||||||||||||||||||||||||||||||||||||||||||||||||||||||||||||||||||||||||||||||||||
|